- / -
Tutorials
Groundwater
Groundwater
Problem 1: Hydraulic Head and Flow Direction
Consider a simple flow system with a dipping aquifer as shown in the figure below. Two piezometers have been installed at different elevations on a hillside (points 1 and 2), where point 1 is located at the top of the hill and point 2 at the bottom. Monitoring data shows that the volumetric flow rate entering the aquifer at the top equals the flow rate exiting at the bottom, indicating no net recharge or discharge along the hillslope.
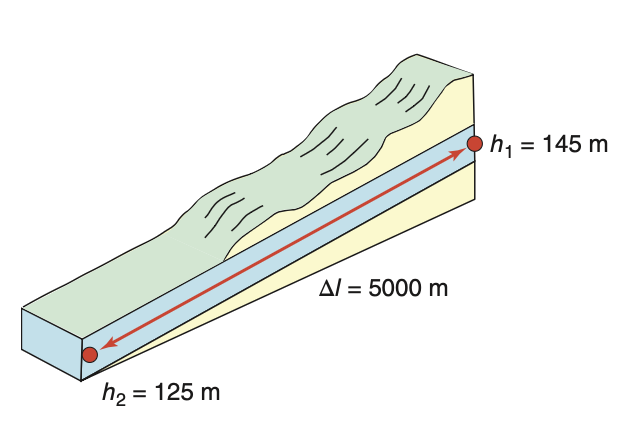
Given data:
- Hydraulic head at point 1:
h_1 = 145 m - Hydraulic head at point 2:
h_2 = 125 m - Distance between measurement points:
\Delta l = 5000 m - Assumption: No recharge between the two measurement points
Tasks:
a) Determine the direction of groundwater flow in this system.
b) Calculate the hydraulic gradient between the two measurement points.
c) Identify where groundwater flow exits this system.
Problem 2: Linear Groundwater Velocity in Different Media
Building on the hydraulic gradient calculated in Problem 1 (i = 0.004), we now want to determine how fast groundwater actually moves through different types of aquifer materials. Laboratory analysis has determined that the hydraulic conductivity of this aquifer is
Given data:
- Hydraulic gradient:
i = 0.004 (from Problem 1) - Hydraulic conductivity:
K = 1 \times 10^{-4} m/sec
Tasks:
a) If the aquifer consists of granular porous medium with a total porosity
b) If instead the aquifer is a fractured shale with the same hydraulic conductivity but different porosity characteristics (total porosity
Problem 3: Piezometer Analysis and Pressure Calculations
You are working as a hydrogeologist and need to analyze data from a piezometer installation. The piezometer has been installed at a site where the ground surface elevation is 1000 m above sea level. Field measurements show that the water level in the piezometer is 25 m below the ground surface, and the total length of the piezometer (depth to measurement point) is 50 m.
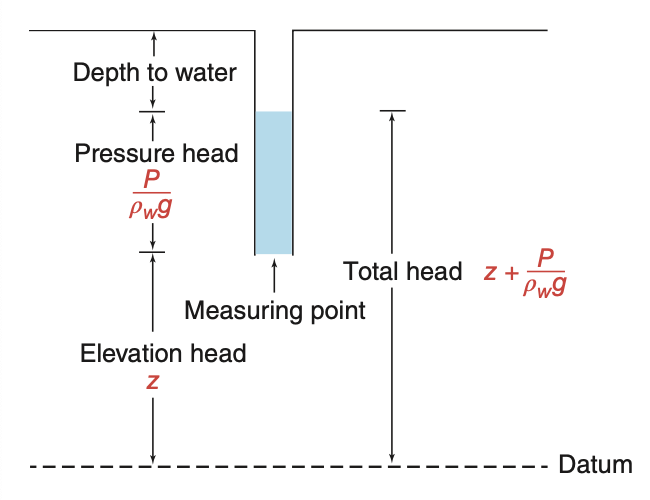
Given data:
- Ground surface elevation: 1000 m above sea level
- Depth to water level: 25 m below ground surface
- Total piezometer depth: 50 m below ground surface
- Water density:
\rho_w = 1000 kg/m³ - Gravitational acceleration:
g = 9.81 m/s²
Tasks:
a) Calculate the total hydraulic head at the piezometer measurement point (bottom of piezometer).
b) Determine the pressure head at the measurement point.
c) Calculate the absolute pressure at the measurement point, expressing your answer in Pascals.
Problem 4: Intrinsic Permeability Analysis
A geotechnical engineering firm has conducted hydraulic testing on a saturated soil sample and determined its hydraulic conductivity to be 15.24 m/day under standard laboratory conditions. You need to determine the intrinsic permeability of this material, which is an important parameter for comparing the flow characteristics of different porous media regardless of fluid properties.
Given data:
- Measured hydraulic conductivity:
K = 15.24 m/day - Test conditions: 20°C temperature, 1 atm pressure
- Fluid: pure water
Task:
Calculate the intrinsic permeability
Problem 5: Flow in Layered Aquifer Systems
You are investigating groundwater flow through a sedimentary sequence consisting of interbedded sandstone and shale layers. Core drilling and geophysical logging have revealed a 300-m thick sequence where sandstone comprises 75% of the total thickness. Laboratory permeability tests show that the sandstone layers have isotropic hydraulic conductivity of
Field observations using tracer tests indicate that groundwater in the sandstone layers flows at an angle of 45° from the vertical direction as it approaches the sandstone-shale boundaries.
Given data:
- Total sequence thickness: 300 m
- Sandstone proportion: 75% (equivalent to 225 m total thickness)
- Shale proportion: 25% (equivalent to 75 m total thickness)
- Sandstone hydraulic conductivity:
K_{sandstone} = 10^{-5} m/sec (isotropic) - Shale hydraulic conductivity:
K_{shale} = 1.92 \times 10^{-12} m/sec (isotropic) - Observed flow angle in sandstone: 45° from vertical toward layer boundary
Tasks:
a) Calculate the equivalent horizontal hydraulic conductivity
b) Calculate the equivalent vertical hydraulic conductivity
c) Using principles of flow refraction, determine the flow direction in the shale layers when groundwater crosses from sandstone at the observed 45° angle.
Problem 6: A Piezometer Nest
A monitoring site on the edge of an irrigation district has four devices installed within ten metres of each other. The ground surface is 120.0 m above sea level. A shallow low-conductivity silt extends from the surface to 35 m depth; below it lies a sand aquifer. All four devices were read on the same morning.
| Device | Screened interval (m below surface) | Depth to water (m) |
|---|---|---|
| Piezometer P1 | 9 – 11 | 4.0 |
| Piezometer P2 | 24 – 26 | 7.5 |
| Piezometer P3 | 59 – 61 | 11.0 |
| Water well W1 | 15 – 60 | 9.2 |
Given data:
- Ground surface elevation: 120.0 m above sea level
- Vertical hydraulic conductivity of the silt:
K_v = 1 \times 10^{-8} m/sec - One year is
3.16 \times 10^{7} seconds
Tasks:
a) Calculate the hydraulic head at the measurement point of each of the four devices.
b) Calculate the vertical hydraulic gradient between each adjacent pair of piezometers (P1 to P2, and P2 to P3). State the direction of vertical flow, and say whether this site is a recharge area or a discharge area.
c) The water well W1 gives a different head again. Explain what its reading represents, and why it cannot be used in the calculation you did in part (b).
d) P1 and P2 are both screened in the silt. Use the gradient between them, with the vertical conductivity of the silt, to calculate the specific discharge through the silt in m/sec, and express it as a recharge rate in mm/year.
e) A colleague proposes saving money by installing one long-screened well instead of the three piezometers. Say what information would be lost.
Problem 7: A Five-Layer Sequence
A sedimentary sequence consists of five horizontal formations of equal thickness, each of them isotropic. From the top down, their hydraulic conductivities are 20, 10, 15, 50 and 1 m/day. Groundwater in the uppermost formation flows at 30° from the vertical as it approaches the first boundary.
Tasks:
a) Calculate the equivalent horizontal hydraulic conductivity
b) Calculate the equivalent vertical hydraulic conductivity
c) Calculate the anisotropy ratio
d) Calculate the direction of flow in each of the five formations, as an angle from the vertical.
e) The bottom formation, the one with
Problem 8: Reading a Potentiometric Surface
Nine wells, all screened in the same confined sand aquifer, were read within the same week. The origin is at the southwest corner of the area,
| 0 | 50.0 | 49.0 | 48.0 |
| 1000 | 48.0 | 47.0 | 46.0 |
| 2000 | 42.0 | 41.0 | 40.0 |
Given data:
- Aquifer thickness: 30 m, constant across the area
- Hydraulic conductivity in the western half:
K = 15 m/day - Steady flow, no recharge to the aquifer through its confining bed
Tasks:
a) Contour the data by hand with a contour interval of 2 m, and mark the direction of groundwater flow with arrows.
b) Calculate the magnitude and direction of the hydraulic gradient in the western half of the area (
c) Calculate the transmissivity of the western half, and from it the discharge through a north-south section 2000 m wide, in m³/day.
d) The flow is steady and nothing is added or removed between the two halves, so the same discharge must cross both. Use that fact to calculate the transmissivity of the eastern half, and state what physically could produce the difference.
e) One of the nine wells is later found to be screened in a deeper aquifer. Explain what that does to your map.
Problem 9: Weighing the Basin from Orbit
The GRACE satellites measure the change in total water storage over the Murray-Darling Basin. Between 2002 and 2006 the basin lost 65 km³ of total water storage. Independent estimates put the soil moisture loss over the same period at 9 km³, and the change in surface water storage at approximately zero.
Given data:
- Area of the Murray-Darling Basin:
1.06 \times 10^{6} km² - Change in total water storage, 2002 to 2006:
-65 km³ - Change in soil moisture storage:
-9 km³ - Change in surface water storage:
0 km³ - Specific yield of the unconfined aquifers, taken as uniform:
S_y = 0.1
Tasks:
a) Express the total water storage change as an equivalent water thickness in millimetres over the basin. This is the quantity GRACE actually reports.
b) Write the water storage budget that relates total water storage to its components, and use it to calculate the change in groundwater storage over the period.
c) The soil moisture estimate comes from a model and could be wrong by 30%. Recalculate the groundwater change for a soil moisture loss of 12 km³ instead of 9 km³, and state how much the answer moved. Then repeat the exercise for the period 2001 to 2003, when the soil moisture loss was 80 km³, and comment on when this method is trustworthy.
d) Convert your groundwater loss from part (b) into an average fall of the water table across the basin, in metres.
e) A student proposes using the same method for the Murrumbidgee catchment alone, an area of 84,000 km². Explain why this will not work.