- / -
Tutorials
Precipitation
Precipitation
The build-up season in the Top End
The late-build-up season in Darwin, NT, is a period of oppressive heat and humidity. The temperature only rises a few degrees, but the humidity skyrockets. It does not rain as often as the wet season, but afternoon thunderstorms are frequent:
- List three atmospheric conditions that must be satisfied before any of these storms can produce precipitation.
- For each condition, explain (≈ 2 sentences) why failure of that condition would prevent rainfall – even under high relative humidity.
Warm vs Mixed-Phase Clouds
Convective downpours over Singapore in March are dominated by warm-rain processes, whereas December snow-storms in the Scottish Highlands rely heavily on the Bergeron ice–crystal mechanism.
- Identify the dominant droplet-growth mechanism operating in each region.
- Describe how cloud-temperature structure and up-draught strength favour those mechanisms.
- State one consequence for raindrop/snow-crystal size distribution at the ground in each case.
Sierra Nevada Transect
Fig. 1 shows a west-to-east cross-section across California’s San Jose from the Pacific coast to Bishop. On your copy of the figure, mark:
- the zone of maximum orographic precipitation.
- the rain-shadow region.
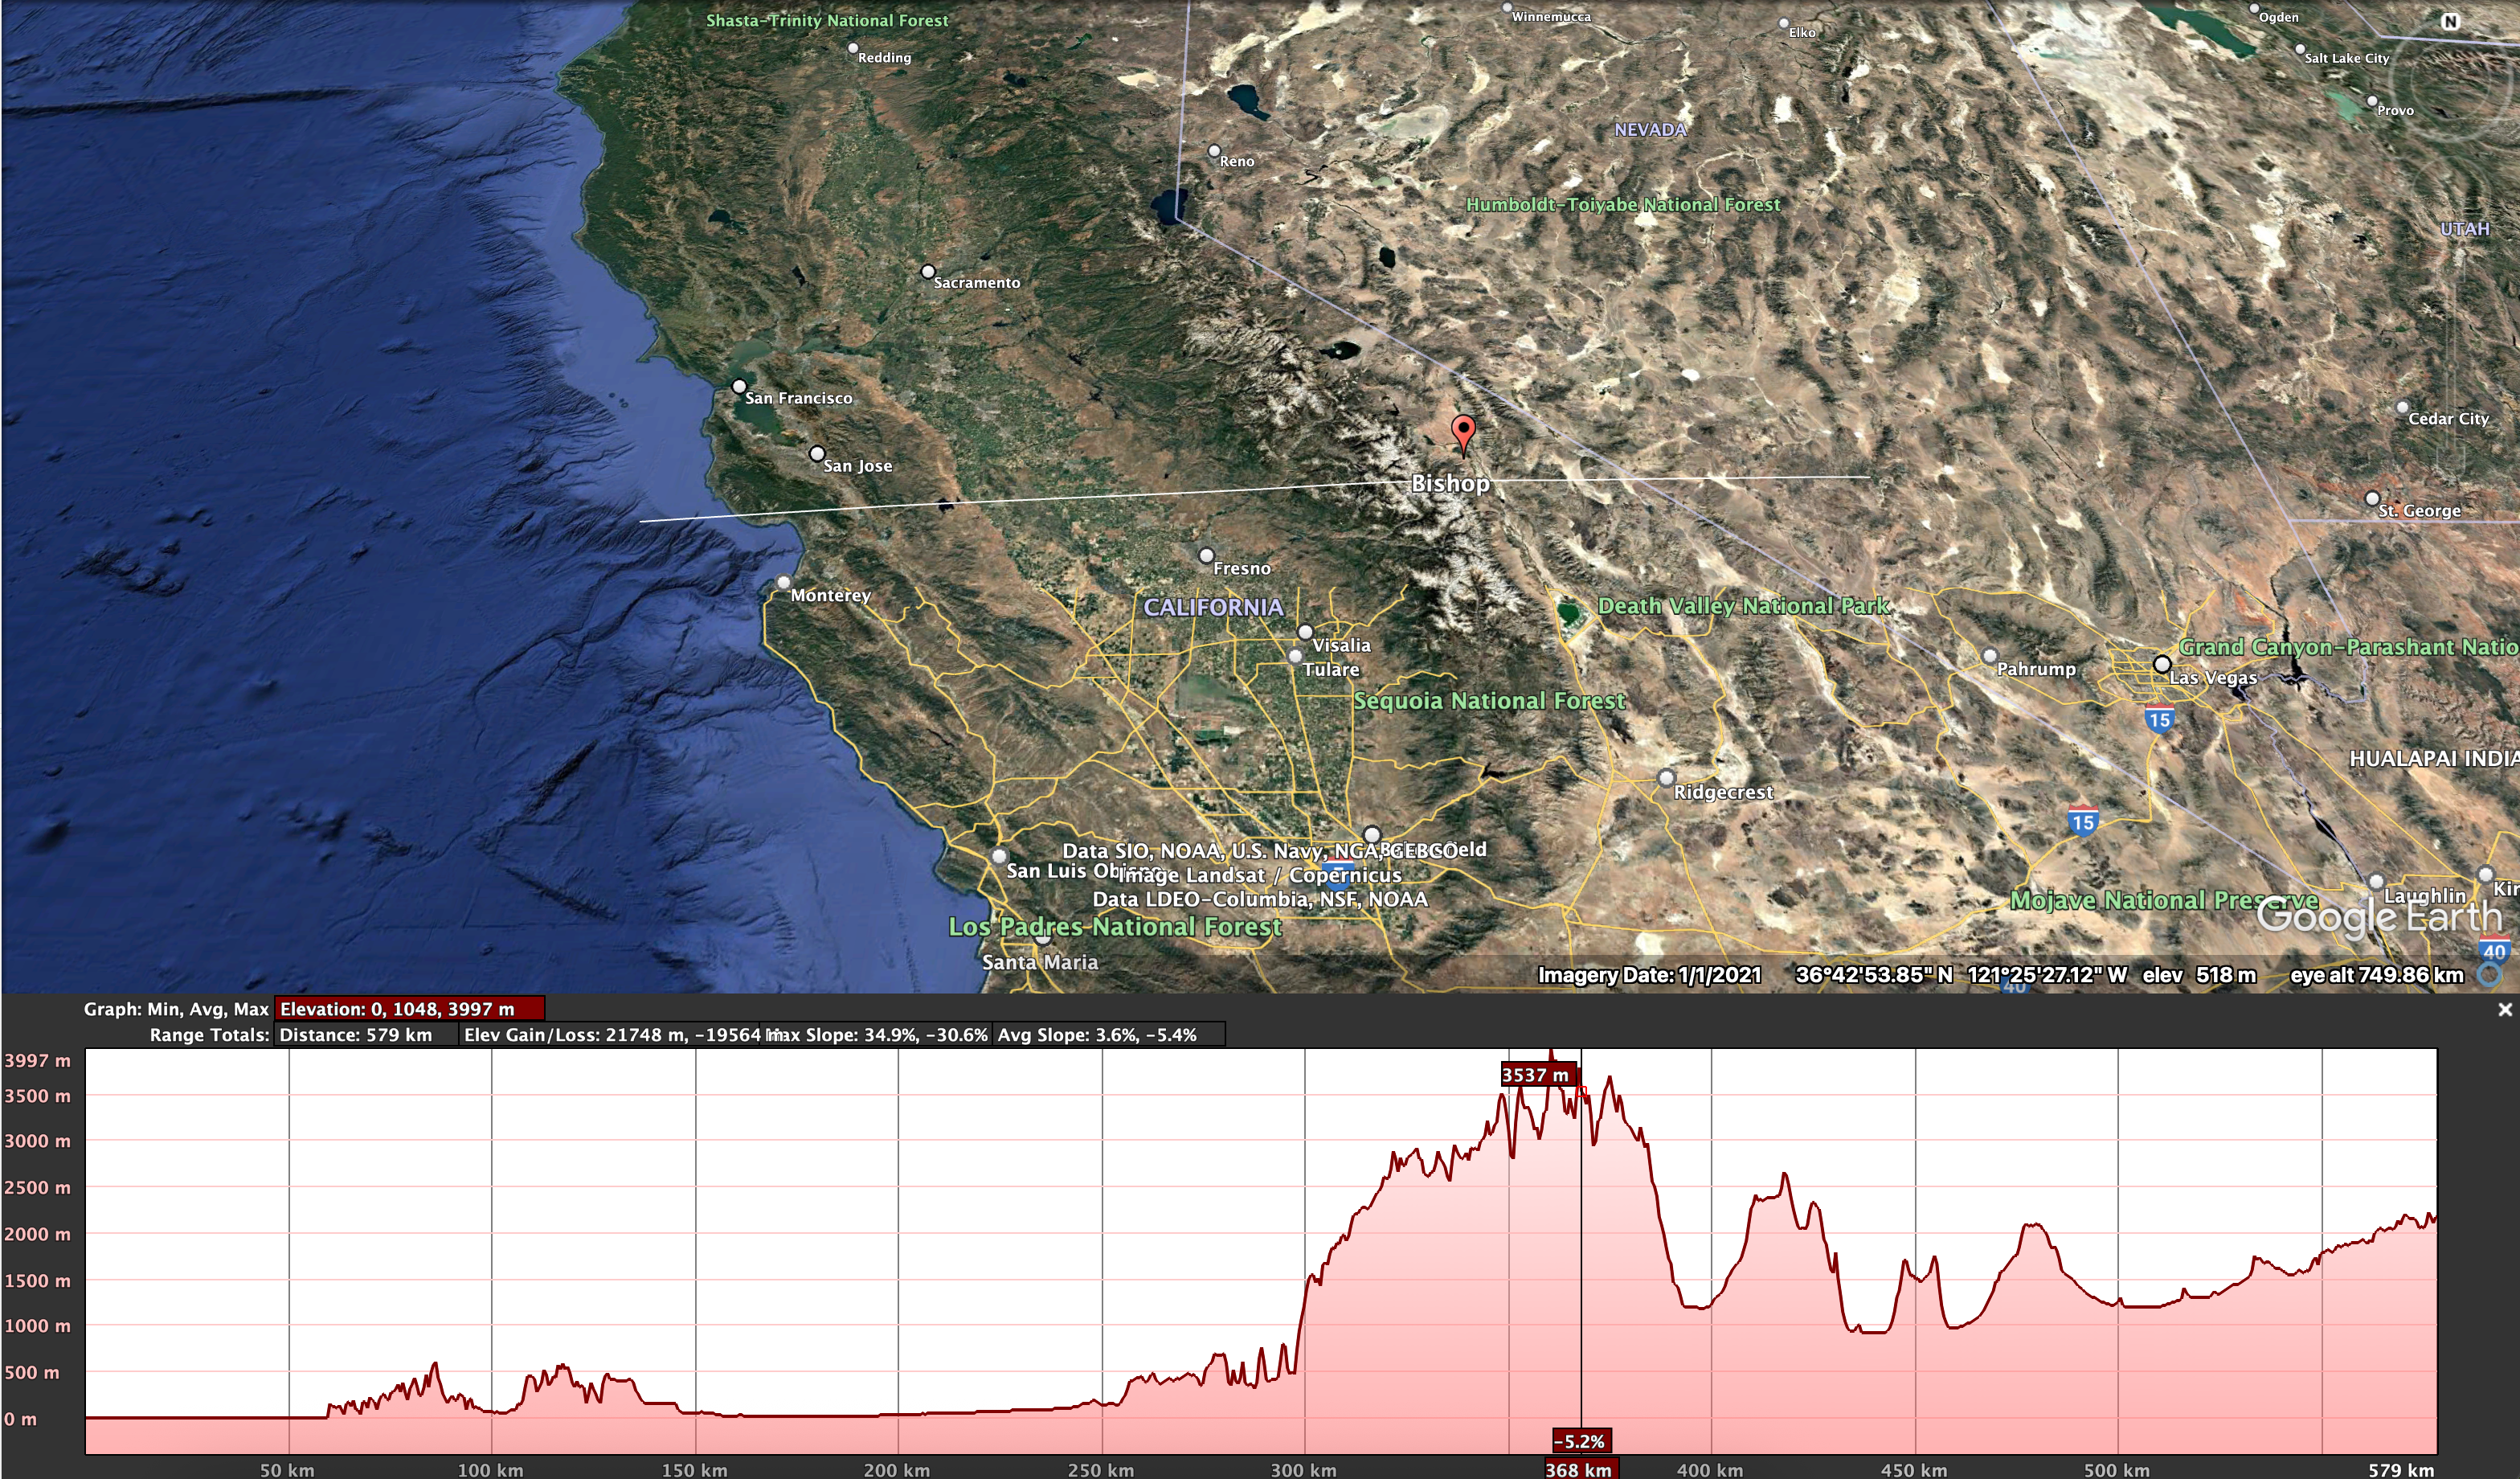
- Annotate approximate temperature changes (°C) of a rising unsaturated parcel that moves:
- sea-level to 3 000 m.
- crest to Owens Valley floor. (Use the dry- and saturated-adiabatic lapse rates as appropriate.).
- (Use your online resources for this:) name two rain-shadow communities east of the crest and discuss, in
\approx 100 words, how this precipitation pattern shapes their water-supply strategies.
Radar Rainfall: from Reflectivity to Depth (fully hypothetical)
A C-band radar on the NSW north coast scans a summer storm cell sitting directly over a tipping-bucket gauge. The cell holds
- Convert each reflectivity to a rain rate using the Marshall–Palmer relation,
Z = 200\,R^{1.6} . Show the step fromdBZ toZ explicitly. - Compute the radar’s one-hour accumulation over the gauge. The gauge itself recorded 26.4 mm. What is the radar’s error, in mm and in per cent?
- Repeat the calculation with a tropical-convective relation,
Z = 32\,R^{1.65} . Comment, in ≈ 3 sentences, on what the two answers together say about the reliability of a singleZ –R law, and on why the gauge total falls between them. - The same radar shows the three symptoms below. For each, name the error mechanism responsible, and state which dual-polarisation variable (
Z_{DR} ,K_{DP} or\rho_{HV} ) would most help, and why.
| Symptom |
|---|
| In winter frontal rain, a bright ring of high reflectivity appears at a fixed |
| A wedge of the map to the west is always drier than the surrounding gauges — every storm, every season. |
| Shallow coastal showers |
Choosing and Trusting a Gridded Product
A
- For each job, choose one product from the lecture (IMERG Early, IMERG Final, CHIRPS, AGCD) and justify it in ≈ 2 sentences, referring explicitly to latency, record length, and what the product is physically based on.
- AGCD is published at
0.05° across the whole continent — the same stated resolution here as in Victoria. Explain why that number means something quite different in the two places, and what you would want to know before quoting an AGCD value for this catchment. - Two satellite products are scored against the two gauges over five wet seasons (table below). Which would you use for the flood trial, and which for the water balance? Product A has almost no bias — explain in ≈ 3 sentences why that is not evidence that it is the better product.
| Product | Monthly bias | Daily RMSE | Daily correlation | POD | FAR |
|---|---|---|---|---|---|
| A — geostationary IR, gauge-calibrated | 0.51 | 0.42 | 0.31 | ||
| B — passive microwave + IR merge | 0.78 | 0.88 | 0.24 |
- In
\approx 100 words, explain why validating an areal satellite estimate against these two gauges is partly circular, and suggest one way to obtain a more defensible check on the product in a catchment this poorly instrumented.