- / -
Tutorials
Runoff
Runoff
Storm Hydrograph Interpretation
Fig. (1) shows a schematic storm hydrograph: stream discharge against time for a small catchment, with the rainfall that caused it drawn as bars from the top.
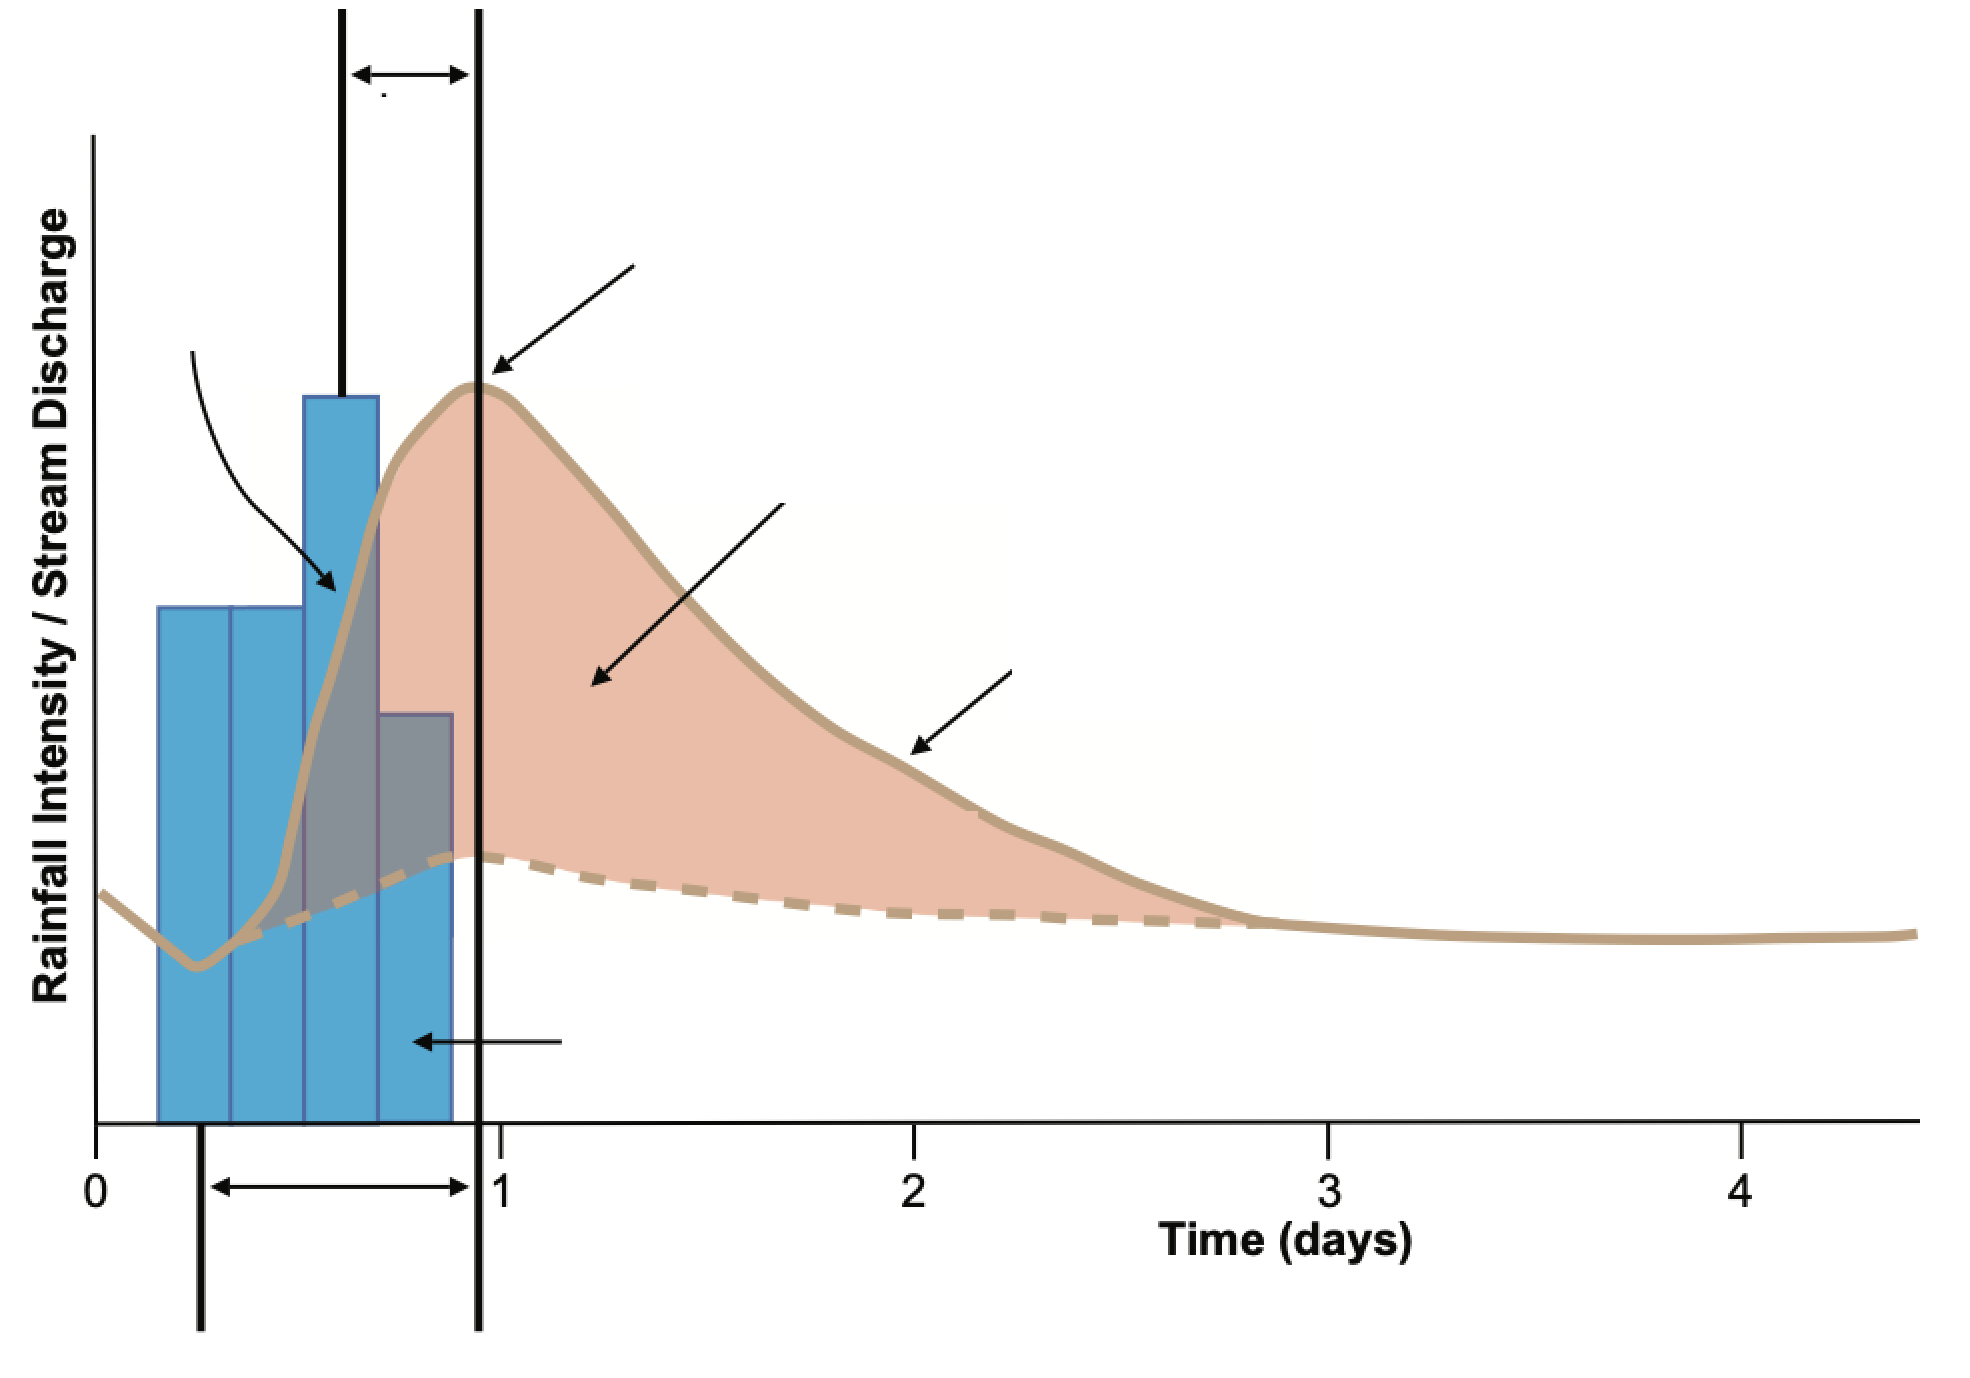
- Clearly identify and label the rising limb, peak discharge, and recession limb of the hydrograph.
- Mark the lag time and say what two points you measured it between.
- Explain, in words, the hydrological processes responsible for each part:
- What causes the steep rising limb?
- Why does the hydrograph peak at a particular time?
- What processes dominate during the recession limb?
- Discuss how antecedent soil moisture and catchment geology can alter the hydrograph shape.
Baseflow separation and the runoff ratio
The storm
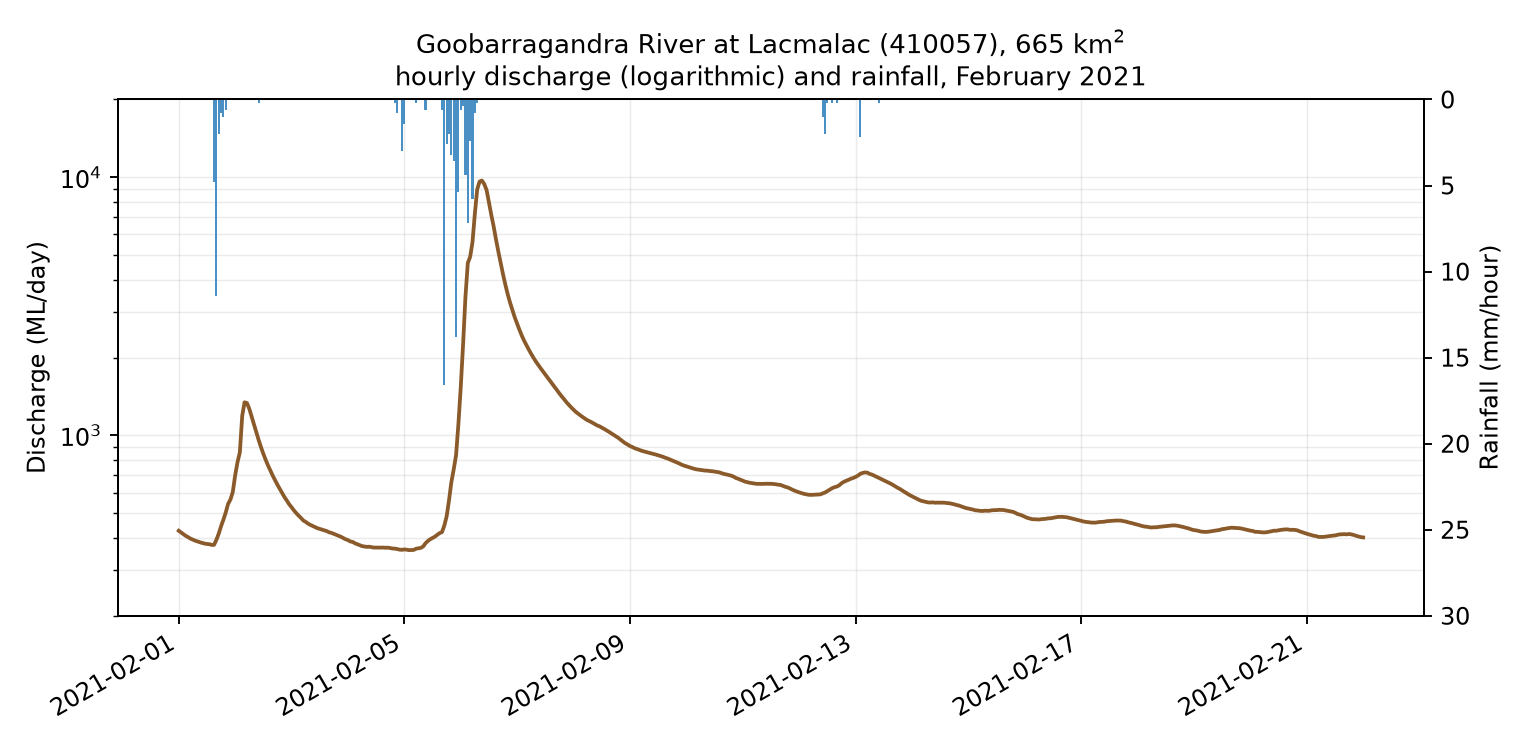
On 5 and 6 February 2021 a storm crossed the Goobarragandra River catchment, a steep forested headwater of the Murrumbidgee. The gauge at Lacmalac (AWRC 410057) drains 665 km² and records rainfall as well as river stage, so one file gives you both sides of this question.
The file is hourly, from 1 to 22 February 2021, with three columns: datetime, discharge_ML_per_day and rainfall_mm. There are no gaps.
One megalitre over one square kilometre is one millimetre
A megalitre is
Discharge in ML/day divided by catchment area in km² is therefore a runoff depth in mm/day, with no conversion factor. This is why Australian hydrology quotes river flow in megalitres.
Tasks
Read the record. Report the peak discharge (in ML/day and in mm/day), the time it occurred, and the lag time between the heaviest hour of rain and the peak.
Separate the baseflow. Draw a straight line from the discharge just before the rise (5 February) to the discharge once the recession has flattened (around 19 February). Everything above that line is stormflow.
Note that Fig. (2) has a logarithmic discharge axis, which is the usual way to plot a hydrograph: on a linear axis the peak flattens every other flow onto the x-axis and the shape of the recession is lost. Do the separation on linear axes, or better, on the numbers themselves. A straight line is not straight once the axis is logarithmic, and the area under a logarithmic curve is not a volume.
Integrate. Sum the stormflow over the event to get a volume in ML, and convert it to a depth in mm over the catchment. Remember the discharge is a rate per day sampled every hour.
Compute the runoff ratio. Total the rainfall for 4 to 6 February and report
\text{runoff ratio} = \frac{\text{stormflow depth (mm)}}{\text{event rainfall (mm)}} Now think about what the number means. Suppose the whole catchment had generated Hortonian infiltration-excess overland flow, and every millimetre of rain that fell on it had run to the channel. What runoff ratio would you have measured? Compare that with your answer, and state the largest fraction of the catchment that could possibly have been contributing.
One honest caveat. The rainfall comes from a single gauge at the outlet of a catchment that rises to about 1,500 m. Which way is that likely to bias your rainfall total, and therefore which way does it bias your runoff ratio? Does the bias strengthen or weaken the argument you just made?
There is a small rise on 2 February, before the main storm. What is it doing to the catchment, and how does it affect the size of the 6 February peak?
Runoff Mechanism Comparison
Hydrologists have proposed different theories for how rainfall becomes streamflow during storm events.
Compare the following three theories:
- Horton’s infiltration-excess overland flow.
- Betson’s partial contributing areas.
- Hewlett & Hibbert’s saturation overland flow.
For each theory:
- Draw a simple sketch of the mechanism.
- State the dominant control (e.g. infiltration capacity, saturated areas).
- Indicate in which type of environment the theory is most relevant (humid vs. arid, forest vs. urban).
Explain why the modern variable source area concept is considered a synthesis of these views.
Two catchments, same rain, different soil
Consider two catchments of the same area, the same general topography and the same land cover. One is developed on deep sandy soils. The other is a clay catchment.
- Evaluate the likely runoff generation mechanism in each, with particular reference to the stormflow generation theories above.
- Illustrate your answer with representative hydrographs. Draw both on the same pair of axes, for the same rainfall input, and make sure the difference in lag time, peak, recession slope and baseflow is visible and deliberate.
- Which of the two would you expect to produce the higher runoff ratio for a given storm, and which the higher annual runoff? These are not necessarily the same answer.
Saturated is not the same as contributing
Fig. (3) is part of a catchment after three days of rain. Four areas, labelled A to D, are saturated to the surface. The contour interval is 5 m and the channels are in blue.
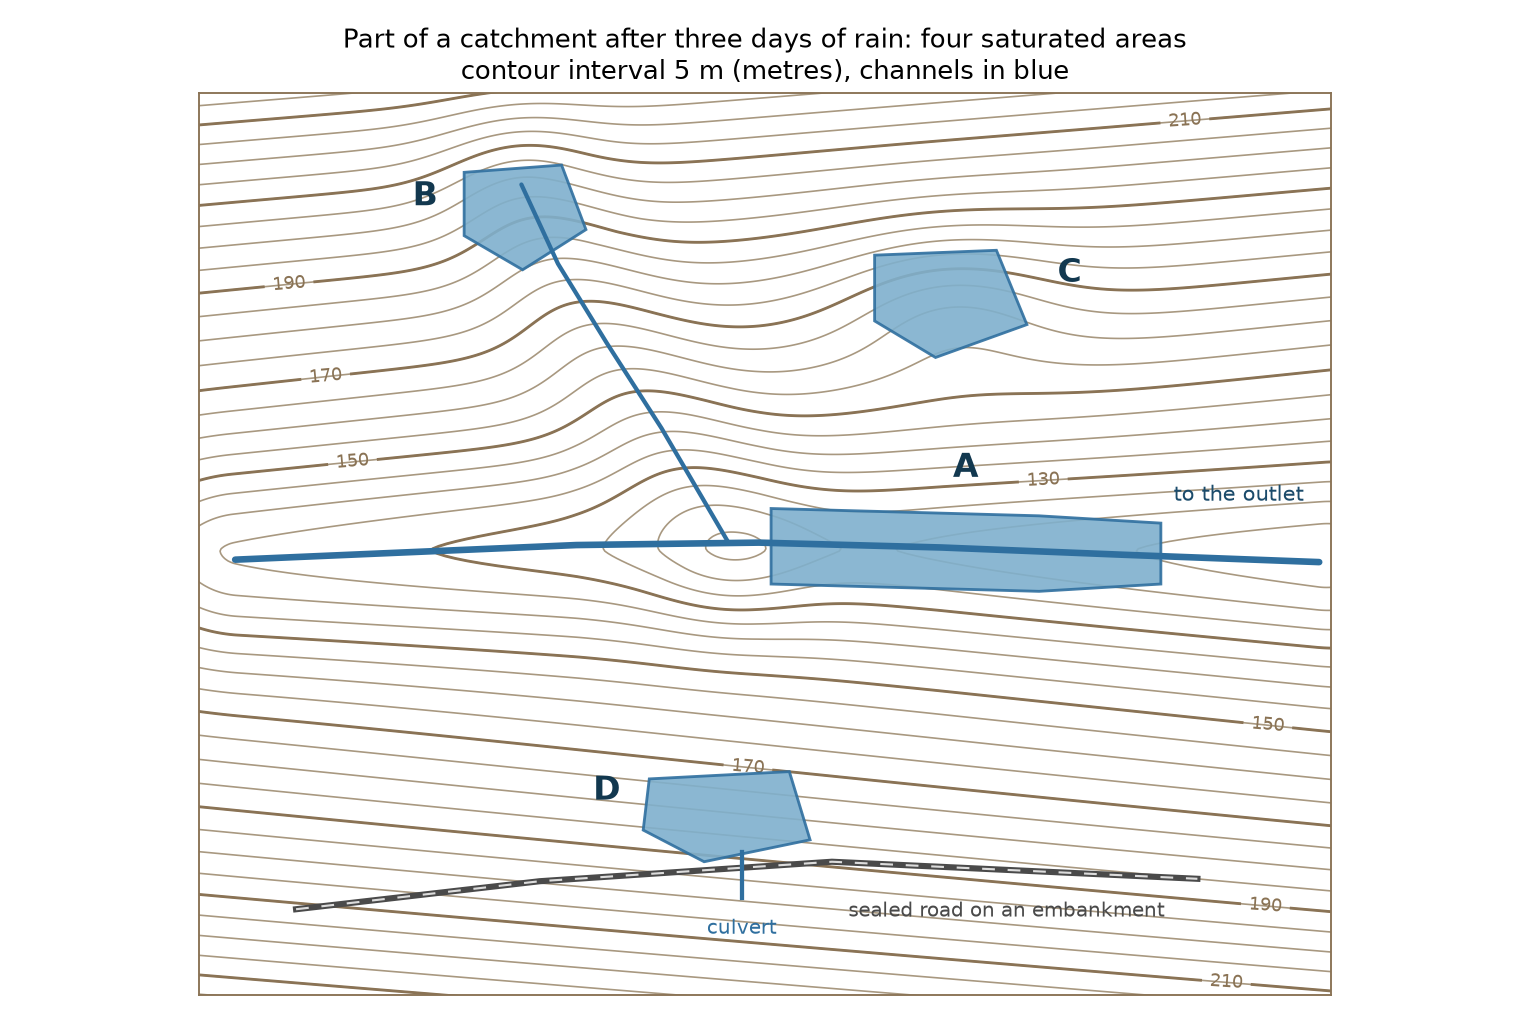
- For each of A, B, C and D, decide whether it will contribute to the storm peak at the outlet, and justify your answer from the topography and the drainage network shown.
- Two of the four are examples of the disjunct source areas described in the lecture. Which two, and what is forcing water back to the surface in each?
- Area C sits on a bench part way up the northern slope. Water is arriving there and it is saturated. Explain where that water goes, and why the hydrograph at the outlet barely knows it exists.
- Area D drains through a single culvert under the road embankment. Describe what happens to the timing and the peak of D’s contribution because of that culvert. Would removing the embankment raise or lower the flood peak at the outlet?
- Write one sentence that states the general principle these four cases share.
Groundwater and Subsurface Contributions
Not all storm runoff comes from direct overland flow. Subsurface processes can be equally important.
- Explain the concept of piston flow and how it differs from throughflow in soils.
- Using the capillary fringe hypothesis, describe how groundwater can rapidly contribute to streamflow during a storm.
- Throughflow through a fine sandy loam moves at roughly 13 mm/hour. Take a hillslope 200 m long. How long would water take to travel from the top of that slope to the channel by matrix throughflow alone? Compare your answer with the lag time you measured in the Goobarragandra storm.
How much of the storm hydrograph is old water?
Return to the Goobarragandra storm. Suppose that during the event you had sampled the stream for oxygen-18 and found the following. Water that had been in the catchment before the storm has a composition of
| time | |
|---|---|
| 5 Feb 18:00 | -6.4 |
| 6 Feb 00:00 | -6.9 |
| 6 Feb 09:00 (the peak) | -7.6 |
| 6 Feb 18:00 | -7.2 |
| 7 Feb 12:00 | -6.7 |
Illustrative values. There is no published isotope record for this gauge; the numbers are typical of a temperate upland catchment.
A two-component separation treats the stream as a mixture of pre-event (“old”) water and event (“new”) rainfall. Writing a mass balance for the water and the same balance again for the tracer gives
Tasks
- Compute
f_{\text{new}} at each of the five sampling times, and plot it against time alongside the hydrograph. - At the moment of peak discharge, what fraction of the water in the river fell during this storm, and what fraction was already in the catchment before it began?
- You now have two percentages for the same storm: the runoff ratio from the separation question, and the new water fraction here. They are not the same number and they are not measuring the same thing. State clearly what each one is a fraction of.
- Using your answer to the throughflow question above, explain why the old water cannot have travelled down the hillslope through the soil matrix during this storm. Then name the three mechanisms from the lecture that can move that much old water that fast, and say what each of them actually moves quickly.
- The separation assumes the two end members are constant through the storm and that soil water is not a distinct third component. Give one physical reason each assumption might fail, and say which way the failure would push your estimate of
f_{\text{new}} .
Design peak flow: the Rational Method
Introduction
The Rational Method estimates the peak discharge from a small catchment. It assumes the maximum runoff occurs when the whole catchment is contributing at once, which happens when the storm lasts at least as long as the time of concentration
In SI units,
where
Where a catchment carries several land uses, the composite coefficient is the area-weighted average of the individual coefficients.
The method predicts peak flows only. Do not use it for volumes or for routing.
Exercise
A 2.4 km² catchment on the fringe of Wagga Wagga contains the following land uses:
| land use | share of catchment | runoff coefficient |
|---|---|---|
| residential housing | 25 % | 0.40 |
| roads and roofs | 15 % | 0.90 |
| parkland on sandy soil | 25 % | 0.15 |
| remnant woodland | 35 % | 0.10 |
The design storm has a rainfall intensity of 78 mm/hour, and the time of concentration is estimated at 20 minutes.
- Compute the weighted runoff coefficient
C_{basin} . - Using , calculate the peak discharge
Q in m³/s. - The remnant woodland is rezoned and becomes industrial hardstand, with
C \approx 0.90 . RecomputeC_{basin} andQ , and report the change as a factor. - The developer argues that the catchment is small and the change is therefore minor. Using your two numbers, and one sentence about where that water now goes, respond.
- The method needs
i at a duration equal toT_c . If the real time of concentration were 40 minutes rather than 20, would the design intensity be higher or lower, and what would that do toQ ?
A satellite that cannot measure discharge
A swath altimeter such as SWOT measures the elevation and the width of the water surface over an area, and therefore the water surface slope along a reach. It cannot measure velocity, and it cannot see the channel below the lowest water surface it has ever observed.
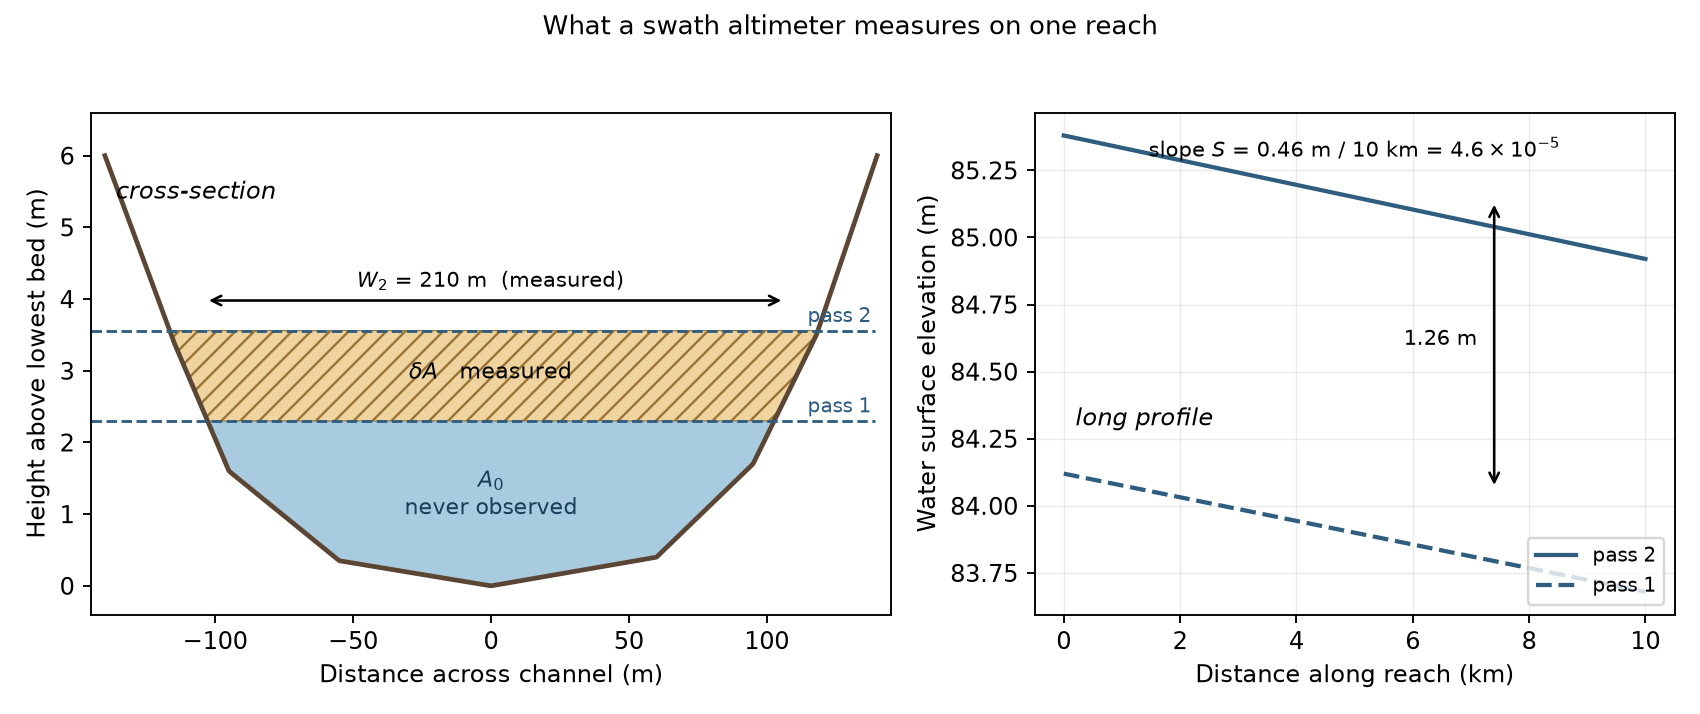
Two overpasses of a 10 km reach give the following.
| quantity | pass 1 | pass 2 |
|---|---|---|
| water surface width | 185 m | 210 m |
| water surface elevation, head of reach | 84.12 m | 85.38 m |
| fall along the 10 km reach | 0.44 m | 0.46 m |
Recall the uniform flow law from the lecture,
For a channel much wider than it is deep, the hydraulic radius
Tasks
- Compute the water surface slope
S at pass 2, and the change in cross-sectional area\delta A between the two passes. Treat the channel between the two water surfaces as a trapezoid, so\delta A \approx \tfrac{1}{2}(W_1 + W_2)\,\Delta h . - Write the cross-sectional area at pass 2 as
A = A_0 + \delta A and substitute into . Which quantities in that expression have you measured, and which have you not? - The unobserved area
A_0 is estimated from a prior at 700 m², plus or minus 20 per cent, and Manning’sn for a river of this size lies somewhere between 0.030 and 0.045. Build a table ofQ forA_0 of 560, 700 and 840 m² againstn of 0.030, 0.035 and 0.045. - Report the central estimate and the full range. By what factor does the answer move across that table?
- The rating curve slide in the lecture warned that discharge is inferred from stage, not observed. In one or two sentences, say what is genuinely different about the satellite estimate, and what is exactly the same.
- SWOT revisits a mid-latitude reach every 21 days. The Goobarragandra peak in the earlier question lasted about a day. What does that imply about using this instrument for flood peaks, and what is it nevertheless good for?